TL;DR
- Five new Corp Dev and M&A roles this week: Booking Holdings, T-Mobile, Harbor, Alloy River, and Banko
- Global M&A hit a record $2.8 trillion in H1, on the fewest deals in six years
- Anthropic's self-reported run-rate passed OpenAI's, but the scoreboard is always stale and never standardized
All content is written by me, with research pulled from online sources and AI. Sources are listed where possible. Some sections include photos and graphs generated to complement the articles.
This Week's Roles
This week's hand-picked roles across Corporate Development, Corporate Strategy, and Buyside M&A:
Senior Manager, Corporate Development
Booking Holdings
Sits on the in-house team sourcing and executing M&A and minority investments across Booking's travel brands (Booking.com, Priceline, Kayak, Agoda, OpenTable). A rare standalone corp dev seat at a company that does large, infrequent deals rather than a steady tuck-in cadence.
Director, Corporate Development
T-Mobile
Leads deal execution across acquisitions, investments, and joint ventures for the carrier, filed internally under its Corporate Strategy group. Director-level scope with a defined 25% bonus target on top of an already high base.
Corporate Development & Integration Manager
Banko Overhead Doors
Owns post-acquisition integration end to end at a PE-backed garage-door platform in active buy-and-build mode, reporting to the CFO with board-level visibility. As much operational standup of acquired companies as it is deal work.
Head of M&A
Harbor
Runs the full buyside engine at a PE-backed legal-services and legal-tech firm, from sourcing through integration, reporting to the CEO. An executive seat for someone who wants to own a buy-and-build rather than support one.
Manager, Corporate Development (M&A)
Alloy River
Builds the buyside function at a fast-growing AI startup applying agentic tools to finance and accounting, backed by Portage, Electric Capital, and a deep bench of operator angels. Owns diligence, modeling and investment memos, and reports to the VP of Corp Dev.
M&A Hit a Record in H1, on the Fewest Deals in Six Years
Global M&A reached a record $2.8 trillion in the first half of 2026, up 48% year-over-year and the strongest six months since the London Stock Exchange Group (LSEG) started tracking deals in 1980. Underneath the impressive headline, the numbers tell a more nuanced story. Total deal count fell 9% to roughly 24,000, the lowest first-half tally in six years.
The rising gap between deal value and deal volume is something we've explored in previous issues, but it's worth revisiting on the newly released H1 data, as it's characteristic of the entire market right now.
Close to half of all H1 value came from just 47 transactions above $10 billion, worth more than $1.3 trillion combined. But the single biggest deal of the first quarter shows what these numbers can hide: SpaceX's all-stock absorption of xAI, which valued xAI at roughly $250 billion inside a combined entity worth about $1.25 trillion, was a merger of two Musk-controlled companies priced with no bank fairness opinion disclosed.
Strip out the giants and the picture is far more subdued: PwC's mid-year read shows that value is down 4% for sub-$5 billion deals, with deals over $5 billion making up 48% of global value, up from 39% in 2025. (keep in mind the 2026 number is an extrapolation of data recorded Jan 1 through May 31). A small number of very large deals are carrying the record while the broad market thins.
There's a second caveat worth naming: a meaningful share of this "M&A" activity is not the strategic dealmaking corp dev teams run. LSEG's Matt Toole described a lot of the activity as "more capital investment" than traditional M&A, with venture capital, private equity, and corporates funding AI and infrastructure companies rather than acquiring them outright. Technology led all sectors at $649 billion announced, and cross-border activity jumped 62% to $893 billion, its strongest start since 2018. And behind all that, investment-grade corporate debt issuance hit $3.4 trillion in H1, up 10%.
Financial services was another story, and we covered this last week. The three spring megadeals that we flagged (Santander/Webster, Zurich/Beazley, and Corebridge/Equitable) accounted for roughly $45 billion combined, but the full H1 picture is more selective. EY's July report shows financial-services deal value fell from $191.3 billion to $134.5 billion on fewer billion-dollar deals - just 25 vs. 37 a year earlier - even as those megadeals still carried about 80% of sector value. Same pattern as the wider market: fewer deals carrying most of the value.
Why This Matters for M&A Professionals
Back in the spring we described a market where value was climbing but most dealmakers were not feeling it. The H1 data makes that disconnect harder to ignore. Announced value is at a record, but the recovery is concentrated in a small number of giant, often atypical transactions. For most Corp Dev teams, the market still looks selective, expensive, and slow below the mega-deal layer.
Sources: London Stock Exchange Group (LSEG) / Reuters (July 2026); PwC Global M&A Industry Trends 2026 Mid-Year Outlook (June 2026); S&P Global Market Intelligence (April 2026); EY Global Financial Services M&A (July 2026); CNBC (February 2026)
The AI Lead That Keeps Changing Hands
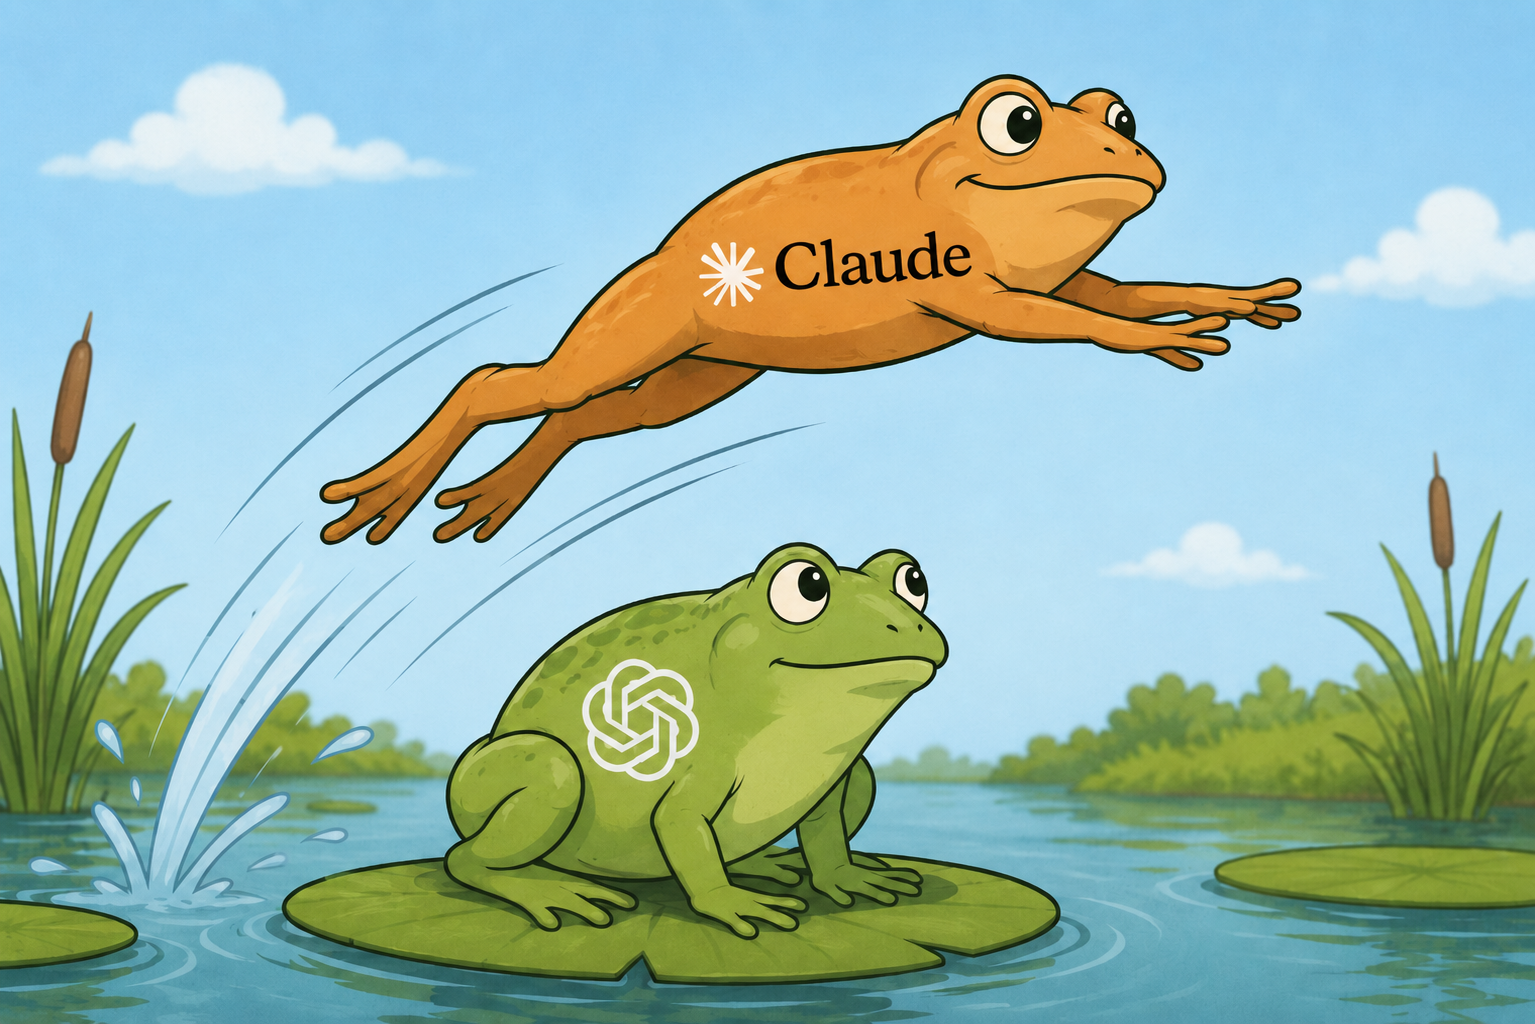
Watching Anthropic and OpenAI trade numbers this year has felt like a game of leapfrog - whoever reported last is ahead, and that lead stands only until the next report.
Anthropic raised in February at $380 billion. OpenAI closed a $122 billion round at $852 billion seven weeks later and doubled past it. On May 28, Anthropic raised again near $965 billion and took the top spot. Anthropic currently leads in terms of self-reported revenue run-rate with a $47 billion figure reported in late May. OpenAI's number, definitely stale by now, was $25 - $33 billion as of February (Fortune).
In the bigger picture, Anthropic does seem to be gaining on OpenAI. A year ago, Claude was not the household name it is today - but everybody and their uncle had heard of ChatGPT, and likely used it. At the close of 2025, OpenAI's run-rate was more than double Anthropic's ($21 billion vs. $10 billion). OpenAI hasn't refreshed its number recently, but Anthropic's growth rate has closed the distance quickly.
The underlying revenue mix is interesting, and points towards different motivations. The reason OpenAI is more of a household name is partially by design - they have far more total clients than Anthropic, and their revenue is significantly weighted towards consumer subscriptions. While they do not publicly disclose a clean revenue split, the current read is that around 60% of their revenue comes from consumer subscriptions, business revenue makes up the remainder. The split is expected to continue skewing towards business revenue as the company grows.
Anthropic's mix is roughly the opposite: around 80% of their revenue comes from enterprise and developer customers, many of them paying per token through the API, with far fewer consumer subscriptions and overall customers.
Both companies have now confidentially filed for IPOs, per PwC's mid-year deal outlook. When they price, they become the two most-scrutinized comps in enterprise software, and the market finally gets audited numbers behind run-rate claims both have been self-reporting.
The Corp Dev Takeaway
When either of these companies comes out and declares themselves the victor, it's important to note that the scoreboard is always stale, and the figures it's based on aren't standardized. When Fortune confirmed on July 2 that Anthropic passed OpenAI in revenue, it was comparing a May figure ($47 billion) to a February one ($25 billion). These were the most recent figures, but were still months apart.
These indicators quickly become irrelevant at the pace these companies are growing. When the IPO filings arrive, the real comparison will not be who claimed the higher ARR number last - it will be revenue quality, gross margin, retention, compute intensity, revenue-share obligations, and how much growth has to be bought with capital.
Sources: Reuters / The Information (March 2026); CNBC (May 2026); Sacra (Q2 2026); Fortune (July 2026); PwC Global M&A Industry Trends, 2026 Mid-Year Outlook (July 2026)
Thank You
Thanks for the support — it means a lot. Consider sharing with your network, or providing feedback here: corpdevcareers.com/contact
I post every Thursday. Subscribe to get the next issue delivered to your inbox.
— Liam